Data-Science-Interview-Questions
- What is meant by Data Science?
It is the blend of statistical, technical skill & business visions which is involved in analyzing the data which are available and used for the prediction of the future trends. - Can you give me the difference between data science, big data & data analytics?
S:NO Data-science Big data Data analytics? 1 It deals with the data slicing & dicing It deals with huge volume of data-structed, unstructured data & semi structured data. It deals with contributing the operational insight into the business scenarios which are complex. 2 We require in depth knowledge about statistics & mathematics We require the basic knowledge about statistics & mathematics We require moderate knowledge about the statistics & mathematics. - State the difference between the Data Science, ML and artificial intelligence?
S:NO Area Data-science Machine-learning Artificial-Intelligence 1 Definition It is not the subset of machine-learning, but this will use it in analyzing and making the future prediction. It is subset of the AI that will focus on the narrow range activities. It focuses on application range from the robotics to the text analysis. 2 Scope It is the broad terms for the diverse discipline, and it is not about developing & training model. It fits within the data science spectrum. It is considered as the sub field of the computer science. 3 AI Integrated loosely. It is the sub fields of an AI. It is the tightly integrated. It is a subfield of the CS which will consist of various of task such as planning, moving all around in world, speech and image recognizing, speaking, performing social, translating / business transaction, creative work. 4 Role It can take on a business role. It is purely a technical role. It is a combination of both business & technical role. - State the difference between Supervised learning & Unsupervised learning?
S:NO Supervised Learning Unsupervised Learning 1 It will enable classification and regression. It will enable classification, density Estimation and Dimension Reduction. 2 It will use training datasets. It will use input datasets. 3 It is used for predictions It is used for analysis. 4 Input data is labeled. Input data is unlabeled. - What language you will prefer for the text analytics? Python or R?
Python: Python has rich library known as Pandas. It will allow the analysts for using the high levels of data analysis tool & DS.
R: R programming is lacking in this feature.
Conclusion: So, the most preferred language for the text analytics is Python.
- What are the very important skills that you should have in python for data analysis?
You should have the following skills that you should have in python for the process of data analysis. They are,
You should know how to use Anaconda distribution and the conda package manager. You should know to profile the performance of the Python Script and optimizing bottlenecks. You should have the ability for performing the elements – wise vectors and matrices operations on the NumPy array. You should have the ability for writing the efficient lists comprehension instead of the traditional for the loop. You should have the ability for writing the small, clear function and preferably pure function which doesn’t alter the object. You should have good knowledge of understanding of build-in data type especially dictionaries, lists, tuples & sets. You should be familiar with the Scikit-learn. You should be a master of N-dimension NumPy Arrays. - What is meant by the Recommender-Systems?
Today the Recommender-systems are widely deploying in the multiple fields such as movie recommendations, social tag, music preferences, search queries research articles and more. It will work based on the collaborative & filtering which based on content / by deploying the approach which based on the personality.
Such type of systems will be worked based on the persons past behaviors for running the module for the upcoming usage. This will be helpful in predicting the product buying in the future, move viewing / books reading by the people. It will also use to create the approach which is based on the filtering by using the discreate characteristics of the items while we are recommending the additional items.
- Can you tell the difference between the Univariate, Bivariate & multivariate analysis?
Univariate analysis: Univariate analysis is a descriptive the statistical analysis technique. We can differentiate it based on number of the variables involved for the point of the time given.
Examples: The pie chart which will be based on the sales on territory will involve one variable & we can call it as the univariate analysis.
Bivariate analysis: whenever the analysis will attempt to understand these differences between two variables at a time in the scatterplot, then this will be known as bivariant analysis.
Example: we can consider bivariate analysis as analyzing volume of scale & a spending.
Multivariate analysis: Analysis which deals with study for more than 2 variables which will be helpful in the effects of the variables on responses is known as the multivariate analysis
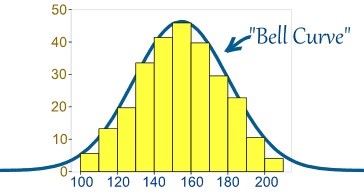
- Explain Normal distribution?
In different way we can able to distribute the data with the bias to left / right / it may jump up. there are many chances that the data will be distributed all around the central values without any of the bias to left / right & reaches the normal distributions in the curve shaped as the bell. Random variables will distribute in a form of the symmetrically curve.

Following are the Properties of Normal Distribution. They are,
Uni-modal -one mode. Symmetrically left & right halve are the mirror image. Bell-shape the maximum heights (mode) at mean Means, Modes, and Medians are in center Asymptotical - How will you use statistics as a data scientist?
Statistics will help the Data scientist to investigate data for the patterns and hidden insight. It will convert the big data as the big insight. This is used to get the better idea about the expectation of the customers.
The data scientist will learn about their customer behavior, engagement, interest, retention & power of the insight of the statistics. These all will be useful in building the powerful data model. This will validate the certain inferences & predictions. All these will be converted to the powerful propositions.
- What is meant by logistics regressions?
Simply we can tell the logistics regression as statistical technique / the model. It will use to analyze the dataset. It will also use to predicting the binary output. The binary output is zero / one / yes / no. The classification, regression & other task on the data are done using a special technique known as Random Forest.
- Why do you think data cleaning is very important in the data analysis?
The data will be input from the multiple sources. We want to clarify that the data is enough for the analysis. The data cleaning is very important for this. It will deal with the detecting process & correcting the data. It will ensure that the data will complete & accurate.
Finally, the component of the data which are irrelevant can delete or modify as required. This process will be deploying in the concurrence with the data wrangling / batches processing.
When these data are cleaned it will conform the rule of the datasets in the systems. Data cleaning is very important in data science. Since, these data can prone to the errors due to the human negligence & corruption during the transmission / storing the other things. It will take large amount of time.
- What can you say about goal of the A/B Test?
It is considered as the statistically hypothesis testing. It is used for randomizing experiment with the two variables such as A & B. Identifying any changes in the web page to maximize or increase the outcome of an interest is the main goal of the A/B test.
A/B testing is one of the best methods figuring out best online promotional and marketing strategies for our business. It will be used to test everything from the website copy to the sales emails & ads. - State the difference between overfitting and underfitting?
One of common task in the statistics and machine learning is fitting the model to the sets of the training data. It will able to makes the reliable prediction on the generally untrained data.
Overfittings: The statistical models will describe the random error / noise instead of underlying relationships. This happening is known as Overfitting. It will occur when the model is very complex. It has many parameters which will relative to number of the observations. The model will be overfit for poor predictive performances. It will be overreacting to the minor fluctuation in training data.
Underfittings: The statistical models / ML algorithm will not capture underlying trends of these data. This happening is known as Underfitting.
Example: When you fit the linear models to the non-linear data. Model like this may have very poor predictive performances.
- What is Cluster sampling?
Cluster Sampling is a simple technique. When we feel difficult to study target populations spread large area and where random sampling cannot be applied, we use Cluster sampling. It is the probability sampling. Each sampling unit is the collections of elements.
Example: A researcher wants to do the survey of the academic performance of high school students in India. At first, he wants to divide the entire population of India into different clusters. Then the researcher wants to select the several clusters depending on the research through simple or systematic random sampling.
- What is mean by Systematic sampling?
Systematic sampling is a statistical technique. It is used where the elements are selected from the ordered sampling frames. This list will be processed in the circular manner in the Symmetric sampling. Once it reaches at end of lists it will start the progress again from the top.
Example: one of the best examples for the Symmetric sampling is equal probability method.
- Can you state some of the real-life scenarios for how will machine learnings be deployed?
Following are few scenarios for how machine learning will be deployed in the real-life. They are,
Search Engine It is a ranking page which will be depend on personal preference of searchers. Extractions of the Information It helps in framing the questions to get the answers from DB from web. Social Media It involve in understanding the relationships and recommending the connections. Robotics It is a machine learning which is used to handle the situations that are not ordinary. Medicare It is design of drugs depending on the patient’s history and requirement. Finance It will Evaluate the investment opportunities and risks. It will also use to detect the fraudulent transactions. Ecommerce It involve in understanding about the customer churns, deploying the targeted advertising & remarketing. - What can you say about K-means and how will you select the K for it?
K stands for the clustering. It can be said as basic algorithm of the unsupervised learnings. This is a method of the classifying data. This is possible by using the set of the clusters simply known as the K clusters. This is deployment for the grouping the data to find the similarity between data.
It will include defining these K centers in the cluster. These clusters are defined as the K groups. This K points will be selected as random. objects will be assigned to the nearest clustering center. This object within the clusters are closely related as possible & differ as possible the object in the other cluster. K-means cluster will work very good for large set of the data.
- How will you differentiate Data modeling from Data design?
Data Modeling: Data modeling is the very first step for designing the DB. The Data modeling creates the conceptual models. The relationship between the various data model will based this. This process will involve in moving from conceptual stage to the logic models to physical forms. It involves the systematic method of applying the data modeling.
Database Design: Data design is a process of database designing. This database design will create an output. The output will provide the detailed data models of this databases. It will include in the detailed logical models of the databases. It will also include the choice of physical design & storage parameter.
- What is mean by Normal Distributions?
It is said as the set of the continuous variables. It will be spread over the normal curves / in shapes of the bell curves. This is considered as the probability distributions. It is very useful in the statistics. This is considered as most common distributional curves. It is very useful in analyzing this variables & their relationship. when you have normally distribution curve.
The normally distribution curves are symmetrical. The non-normally distribution approach the normally distributions as a size of the sample increase. This is also easy in deploying Central Limited Theorem.
- What is mean by false positive and false negative? Can you give few examples where the false positive is very important than the false negative?
False Positives: It is case where we wrongly classified the non-event as the events. We can say this error as the type I.
False Negatives: It is case where we wrongly classify the events as the non-events. We can say this error as the type II.
Example: Consider the medical field that given the Gallbladder treatment to the patients. The lab test patient for the certain information & based on these results they will decide to remove the gallbladder.
Assume the patient come to the hospital & he must remove Gallbladder (Actually he is not having the Gallbladder issues) based on the lab predictions. What is going to happen for him? (Assuming the Sensitivity is one) - Explain the difference between the Test Sets & the Validation Sets?
Validation sets: It is said as the part of training sets. It is used with the parameter selections & to avoid the Overfitting of building model.
Test sets: It is used to test / evaluate the performance of trained machine-leaning models.
The differences are as follows. They are
• Training Sets is used for fitting the parameters.
• Test Sets is Used for assessing their performance of the models. It will evaluate the predictive powers &
generalization it.
• Validation sets is to tune their parameters. - Can you explain the Gradient Descents?
The gradients: It will measure the changes in output of the functions while we change the inputs a little bit. It simply measures the changes in all the weights about the changes in the error. The gradient is a slope of the functions.
Gradient Descents: It is climbing down to bottom of the valley, instead of climbing up the hills. This is because this is minimization of the algorithms. It will minimize the given function.
- What can you mean by Back Propagation and Explain how it Works?
Backpropagation is the training algorithms. It is used for the multilayer neural network. This method is used to move the error from the end of network to all the weights inside the networks. It will allow the computations of the gradients.
It involves in the steps which are follows. They are,
• Forwarding the Propagations of the Training Data
• Derivative is computed using output & target
• Back Propagate for computing derivative of error writing output activations
• Using the previous calculated derivative for the output.
• Update their Weights - What is mean by variants of Back Propagation?
Stochastic Gradient Descents: It use only single training.
Batch Gradient Descents: It will calculate the gradient for whole of the dataset & perform the updates about each of the iterations.
Mini batch Gradient Descents: It is one of the best optimization algorithms. It is variant of Stochastic Gradient Descents.