
Tableau Training
Hope Tutors provides the best Tableau Training in Chennai at affordable fees. We designed the tableau course module as that you can learn & master the concepts of Tableau.
Why Tableau Training in Chennai from us ?
Job Opportunities – Right after the completion of your course, we would help in fulfilling the purpose of tableau training with us, Mock Interviews with HR, Tableau Interview Questions that aligns with the latest syllabus and finally the Visualised Resume.
Anytime Access – You can access your Course Videos and Materials anytime with us.
Customer support – There will be lifetime support from us, we always listen to your queries even you left us, we always keep the door open for the Alumni.
5-10+ Experienced Trainers – The trainers from whom you are gonna learn are industry experts with 10+ years experience. Trainers are Friendly and also provides Real time Projects to expose yourself to the Domain.
What is Tableau ?
What are the Features of Tableau
- Revision History
- Cross-database join
- Device designer
- REST API improvements
What are the Benefits of Tableau
- Build Interactive Dashboards
- Portability
- Easily Connect to R
- Supports Mobile Devices
- Large Integration
What are the Tableau Course Objectives?
- Understanding the main Tableau interface with real-time working projects
- Build visualizations with the data.
- Build Interactive Dashboards.
- Data Reshaping and Formatting.
- Show trends or change over time.
- Usage of Maps and Spatial Analysis
- Creation of Waterfall Chart in Tableau and Donut Charts.
- Best Practices and analytical techniques using Tableau.
Who should take Tableau Training in Chennai
- Data Scientist who are keen on presenting their data in a rich manner
- Marketing Professionals who are keen on Delivering their sales achievement and valuable insights to their boss
- Developers who are changing their den to Big Data.
- People who are working on heavy loads of data every day and depending on excel to get the insights
Pre-requisites for taking Tableau Training in Chennai
- Technically speaking Tableau works mostly on the data processing, So it is always good to have some additional tools/technology related to the Data Processing
- Knowledge in SQL, R and Python is Commendable for Tableau Training.
Tableau Course Salary Trends
Data is going on the rate of knots, as the hunt for people who works on the data processing too. Big Giants always needs the people who can consistently give insights on improving and scaling the business, so there is no Shortage of Jobs in Tableau, skyrocket your career by our Updated Tableau training in Chennai.
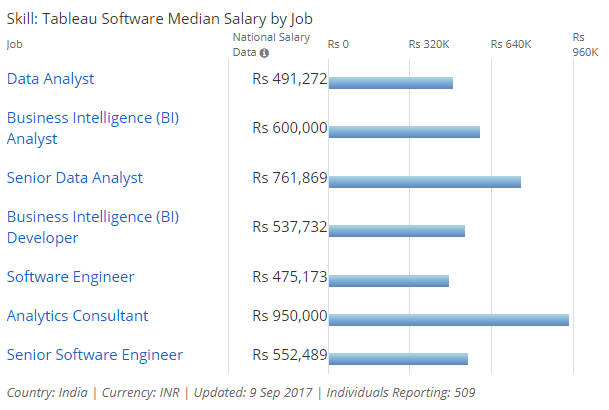
Tableau Course Certification
Tableau Course Certification Can be done on the two streams.
- Tableau Desktop
- Tableau Server
Tableau Desktop Certification would be apt for analysts and data visualization professionals who mostly design and create interactive Tableau dashboards.
Tableau Server Certification is a good choice for the database administrators, The professionals who involve in the data layer administration of existing and ongoing Tableau reports can also take the Certification.
Each certification stream consists of
- Qualified Associate
- Certified
- Professional
- Delta Exam.
Qualified Tableau Associate is a prerequisite exam for your professional tableau certification. We always recommend the people to have Tableau experience for at least 5+ months prior to attempting the exam.
Qualified Professional would give you the designation of Tableau Certified Professional. According to Tableau guidelines, you need to have at least 11 months of Tableau experience prior to attempting the exam.
Delta examination needs to take for renewing your certification once a new version of Tableau comes out.
Tableau pushes you to complete the Tableau Fundamentals and Advanced courses since it makes you a Complete Tableau Certified Professional.
Reach us today through call/ email/chat to know more about the other Data Visualisation /Analytics Training Courses Hope Tutors wishes you good luck in your career growth.
Frequently asked Questions
Would you provide Admin level or Developer level training ?
We Provide the both admin and developer level training.
Would You Provide Tableau Software ?
What about the Job Opportunities after course ?
Who should attend Tableau ?
Would you Provide a Free Demo Session ?
What is the Tableau Trainer Experience ?
The Experience Would be around 5-10 Years, We handpicked the trainers from extensive screening of the profiles with Quality Check.
Is the Trainer Experience hands on ?
Is the Tableau training Advanced level ?
Yes, Our Course Module Covers all the Advanced Concepts, so that you never stuck in the Outdated Concepts.
Would you provide tableau certification ?
Yes, We provide Tableau Certification.
Discover the Other Courses
Course Curriculum
| Introduction and Overview | |||
| Why Tableau? Why Visualization? | 00:00:00 | ||
| Level Setting – Terminology | 00:00:00 | ||
| Getting Started – creating some powerful visualizations quickly | 00:00:00 | ||
| Product Line of Tableau | 00:00:00 | ||
| Things you should know about Tableau | 00:00:00 | ||
| Concepts and Options when Connecting to Data | |||
| Overview of other connection options | 00:00:00 | ||
| Joining multiple tables | 00:00:00 | ||
| Data Blending | 00:00:00 | ||
| Copy and Paste | 00:00:00 | ||
| Data Extracts | 00:00:00 | ||
| Custom SQL | 00:00:00 | ||
| Publishing and Re-using Data Connections | 00:00:00 | ||
| Understand how to deal with data changes in your data source such as field addition, deletion or name change | 00:00:00 | ||
| Re-using and sharing data connections – the concept of meta data | 00:00:00 | ||
| Working with multiple connections in the same workbook | 00:00:00 | ||
| Getting Started | |||
| Connecting to Data and introduction to data source concepts | 00:00:00 | ||
| Working with data files versus database servers | 00:00:00 | ||
| Understanding the Tableau workspace | 00:00:00 | ||
| Dimensions and Measures | 00:00:00 | ||
| Using Show Me! | 00:00:00 | ||
| Tour of Shelves (How shelves and marks work) | 00:00:00 | ||
| Building Basic Views | 00:00:00 | ||
| Help Menu and Samples | 00:00:00 | ||
| Saving and Sharing your work | 00:00:00 | ||
| Saving and Sharing your work | 00:00:00 | ||
| Analysis | |||
| Creating Views | 00:00:00 | ||
| Marks | 00:00:00 | ||
| Size and Transparency | 00:00:00 | ||
| Highlighting | 00:00:00 | ||
| Working with Dates | 00:00:00 | ||
| Date aggregations and date parts | 00:00:00 | ||
| Discrete versus Continuous 3 | 00:00:00 | ||
| Dual Axis / Multiple Measures | 00:00:00 | ||
| Combo Charts with different mark types | 00:00:00 | ||
| Geographic Map | 00:00:00 | ||
| Page Trails | 00:00:00 | ||
| Heat Map | 00:00:00 | ||
| Density Chart | 00:00:00 | ||
| Scatter Plots | 00:00:00 | ||
| Pie Charts and Bar Charts | 00:00:00 | ||
| Small Multiples | 00:00:00 | ||
| Working with aggregate versus disaggregate data | 00:00:00 | ||
| Analyzing | 00:00:00 | ||
| Sorting & Grouping | 00:00:00 | ||
| Aliases | 00:00:00 | ||
| Filtering and Quick Filters | 00:00:00 | ||
| Cross-Tabs (Pivot Tables) | 00:00:00 | ||
| Totals and Subtotals | 00:00:00 | ||
| Drilling and Drill Through | 00:00:00 | ||
| Aggregation and Disaggregation | 00:00:00 | ||
| Percent of Total | 00:00:00 | ||
| Working with Statistics and Trend lines | 00:00:00 | ||
| Getting Started with Calculated Fields | |||
| Working with String Functions | 00:00:00 | ||
| Basic Arithmetic Calculations | 00:00:00 | ||
| Date Math | 00:00:00 | ||
| Working with Totals | 00:00:00 | ||
| About Custom Aggregations and Logic Statements | 00:00:00 | ||
| Logic Statements | 00:00:00 | ||
| Formatting | |||
| Options in Formatting your Visualization | 00:00:00 | ||
| Working with Labels and Annotations | 00:00:00 | ||
| Effective Use of Titles and Captions | 00:00:00 | ||
| Introduction to Visual Best Practices | 00:00:00 | ||
| Building Interactive Dashboards | |||
| Combining multiple visualizations into a dashboard | 00:00:00 | ||
| Making your worksheet interactive by using actions and filters | 00:00:00 | ||
| An Introduction to Best Practices in Visualization | 00:00:00 | ||
| Filtering, Sorting & Grouping | |||
| Advanced options for filtering and hiding | 00:00:00 | ||
| Understanding your many options for ordering and grouping your data: Sort, Groups, Bins, Sets | 00:00:00 | ||
| Understanding how all of these options inter-relate | 00:00:00 | ||
| Working with Data | |||
| Data Types and Roles | 00:00:00 | ||
| Dimension versus Measures | 00:00:00 | ||
| Data Types | 00:00:00 | ||
| Discrete versus Continuous | 00:00:00 | ||
| The meaning of pill colors | 00:00:00 | ||
| Database Joins | 00:00:00 | ||
| Data Blending | 00:00:00 | ||
| Working with the Data Engine / Extracts and scheduling extract updates | 00:00:00 | ||
| Working with Custom SQL | 00:00:00 | ||
| Adding to Context | 00:00:00 | ||
| Switching to Direct Connection | 00:00:00 | ||
| Building meta data via shared Data Source connections | 00:00:00 | ||
| Performance considering and working with big data | 00:00:00 | ||
| Working with Calculated Data and Statistics | |||
| A Quick Review of Basic Calculations | 00:00:00 | ||
| Arithmetic Calculations | 00:00:00 | ||
| String Manipulation | 00:00:00 | ||
| Date Calculations | 00:00:00 | ||
| Quick Table Calculations | 00:00:00 | ||
| Custom Aggregations | 00:00:00 | ||
| Custom Calculated Fields | 00:00:00 | ||
| Logic and Conditional Calculations | 00:00:00 | ||
| Conditional Filters | 00:00:00 | ||
| Advanced Table Calculations | 00:00:00 | ||
| Understanding Scope and Direction | 00:00:00 | ||
| Calculate on Results of Table Calculations | 00:00:00 | ||
| Complex Calculations | 00:00:00 | ||
| Difference From Average | 00:00:00 | ||
| Discrete Aggregations | 00:00:00 | ||
| Index to Ratios | 00:00:00 | ||
| Reference / Trend Lines | 00:00:00 | ||
| Understanding where Calculations Occur Statistics | 00:00:00 | ||
| Statistical Calculations | 00:00:00 | ||
| Summary Stats | 00:00:00 | ||
| Cohort Analysis | 00:00:00 | ||
| Working with Dates and Times | 00:00:00 | ||
| Continuous versus Discrete Dates | 00:00:00 | ||
| Dates and Times | 00:00:00 | ||
| Reference Dates | 00:00:00 | ||
| Advanced Mapping | |||
| Fundamentals Review: Building basic maps | 00:00:00 | ||
| Fixing geographies | 00:00:00 | ||
| Geographic Fields | 00:00:00 | ||
| Map Options | 00:00:00 | ||
| Built-in Demographics / Layering | 00:00:00 | ||
| WMS – working with a Web Map Service | 00:00:00 | ||
| Importing Custom Geographies | 00:00:00 | ||
| Assigning Geographies to Non-Geographic fields | 00:00:00 | ||
| Distance Calculations | 00:00:00 | ||
| Spatially Visualizing non-Geographic Data using background images and geo-coding | 00:00:00 | ||
| Working with Parameters | |||
| Parameter Basics | 00:00:00 | ||
| Data types of parameters | 00:00:00 | ||
| Using parameters in calculated fields | 00:00:00 | ||
| Inputting parameter values and parameter control options | 00:00:00 | ||
| Advanced Usage of Parameters | 00:00:00 | ||
| Using parameters for titles, field selections, logic statements, Top X | 00:00:00 | ||
| Building Advanced Chart Types and Visualizations / Tips & Tricks | |||
| Bar in Bar | 00:00:00 | ||
| Box Plot | 00:00:00 | ||
| Bullet Chart | 00:00:00 | ||
| Custom Shapes | 00:00:00 | ||
| Gantt Chart | 00:00:00 | ||
| Heat Map | 00:00:00 | ||
| Pareto Chart | 00:00:00 | ||
| Spark Line | 00:00:00 | ||
| KPI Chart | 00:00:00 | ||
| Building Better Dashboards | |||
| Interactive Dashboards | 00:00:00 | ||
| Quick Filters | 00:00:00 | ||
| Dashboard Objects | 00:00:00 | ||
| Filter Actions | 00:00:00 | ||
| Highlighting and Actions | 00:00:00 | ||
| Performance | 00:00:00 | ||
| Publish to Web | 00:00:00 | ||
| Zones | 00:00:00 | ||
| Guided Analytics | 00:00:00 | ||
| Cascading Filters | 00:00:00 | ||
| Highlighting | 00:00:00 | ||
| Quick filter Options | 00:00:00 | ||
| Select then See Visual Self-Populating Dashboards | 00:00:00 | ||
| Shortcuts | 00:00:00 | ||
| URL Actions | 00:00:00 | ||
| Overview – Working with Tableau Server | |||
| Publishing to Tableau Server – Overview of publishing, scheduling & security options | 00:00:00 | ||
| Tableau Server Usage – Interacting with Published Visualizations | 00:00:00 | ||
Features
FAQ
Course Reviews
Related Courses

Data Science Online Training
PRIVATE 3945Splunk Training in Chennai
PRIVATE 2135Qliksense Training in Chennai
Apply to enroll 2833


good institute to study Tebleau
The Tableau training program from Hope Tutors was excellent. This is the first time I have completed the online learning, earlier I attended classroom training. Both are awesome and all the queries were answered appropriately. I am satisfied thank you.
i refer Hope tutors for tableau
Good place to study Tableau, trainer was interacts well and training syllabus is perfect.
perfect place to study Tableau
Experienced Trainer, I like the examples given by trainer which more useful. practical session is awesome
good institute
Training environment is good, trainer has good knowledge about Tebleau, syllabus topic are perfect and enough.
Tableau Training in Chennai at Affordable Fees
When someone asks the best tableau training in Chennai, i would recommend the Hope Tutors.Experienced Trainers and Updated Course Syllabus at affordable fees.