What is Power BI – Getting Started with Microsoft Power BI
This article will help you to start with this service of Power BI. For your best knowledge about how this service will fit for you. Especially, in the offering of other Power BI, I highly recommend this article. This will clearly help you by describing about what Power BI is.
This article will completely undergo the steps which are as follows. They are,
- Find other content to start with the service of the Power BI.
- Log into your Power BI online account or create one if you don’t have one.
- Now Open the service of Power BI.
- You can get some of the data. Also, you can open this in the view of report.
- To create visualization, you can use that data. Also, it will save as the report.
- You can create a dashboard. This is possible from the reports by pinning tiles.
- Also, you can add another visualization to dashboard. This is possible with the help of Q&A natural language tool.
- You can clean up your resources. This is possible by deleting the dataset, report as well as dashboard.
Creating new account for the service of Power BI:
If you did not sign up for Power BI? You can create for a free trail of the Power BI Pro. This will be the first step before beginning.
If you are having an account? Then open a browser and type app.powerbi.com to open the service of Power BI.
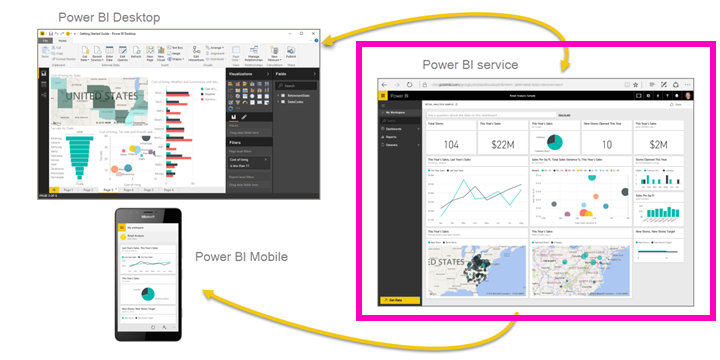
If you are seeing for a help with the desktop of Power BI? Then see Get started with Power BI Desktop. If you are seeing for the help with the Power BI mobile? Then see the app for Power BI for the mobile devices.
You can also visit their official playlist on the YouTube. There are many good videos available for you. This will help you to begin with the introduction. Especially about the service of Power BI.
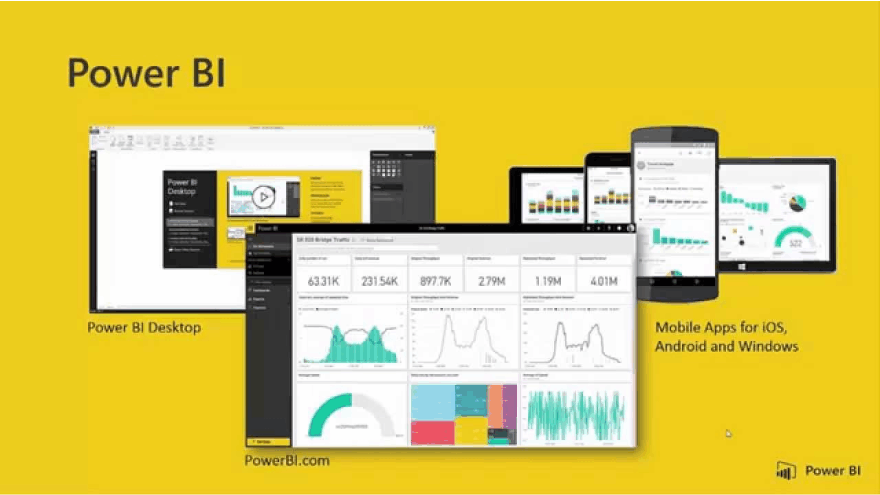
About the Service of Power BI:
This service is also called as Power BI online/app.powerbi.com. This will help you to stay us update. With this service, dashboards will often help you. It will help you in such a way they keep cross your finger. Especially for the business pulse. Dashboards will display the tiles. Click to open the reports and to further check. This is especially for further exploring. Connecting to the multiple data sets. It will bring together all relevant data in single place. If you need any help in gathering the knowledge about the stuffs of Power BI? Then you see the Basic concepts in power BI service for the designers.
Let us consider you important the data in Excel/CSV files? Then you want to create a dashboard of Power BI? This is to stay very informed at anywhere as well as share the other insights. If you have the subscription to app like Salesforce, it is for you. You can start the app via Salesforce. Dashboard will automatically create from that data. In other side it will check out with all other SaaS (apps) which you connected with. You can see the apps published if you are one of industry part.
First Step is to get the data:
Here is an example for getting the data from CSV file. You can download the sample files of CSV. It is available in the official website.
- Sign into Power BI. This is possible if you have a Power BI account. Else, simply stop worrying. You can just create a new one for a free trial.
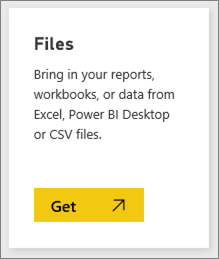
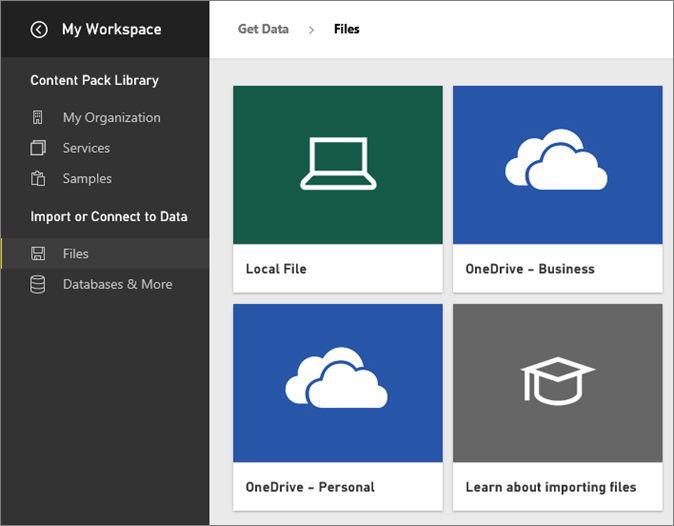
- Power BI will open in the browser. You can Select the option to get data. It will be at bottom of navigation bar.
- Select the Files.
- Browse the file on your system. Then you want to select Open. If you saved it in OneDrive for Business? Then you want to select that option. If you saved it locally? Then you want to select Local file.
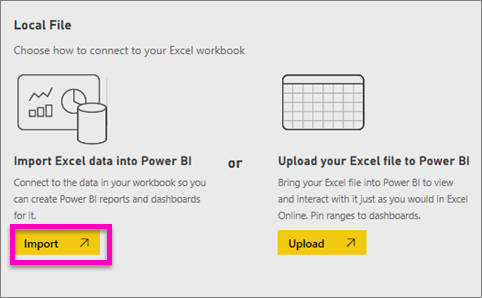
- In this article, we are going to select the Import. This is to add the Excel file. Especially, as dataset. We can then use this to create the reports as well as dashboards. Then If you select the Upload? Then the Excel workbook will upload in the Power BI. There you may open as well as you can edit this in the Excel online.
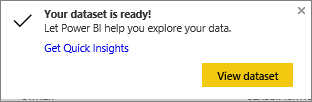
- Once your dataset is ready then select the View dataset. This is to open this in the report editor.
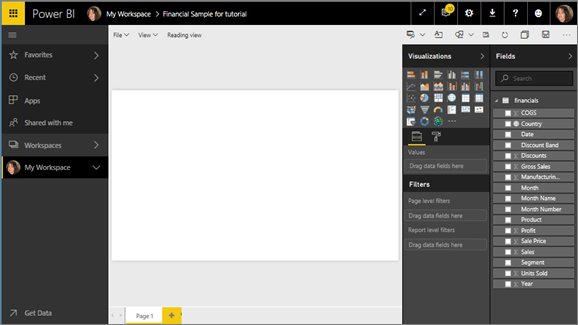
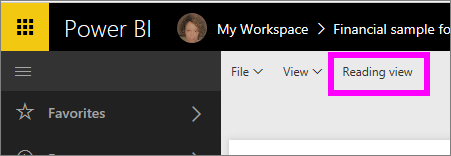
- Look at the top menu bar. Then you can notice that there is an option. Especially for the view of Reading. Since, you have an option for Reading view. It means you are currently in the Editing view.

Since, we have not created any of the visualizations yet. Then the canvas report will be blank.
In the Editing view you can able to create as well as modify the reports. This is because you are the owner for the report. Then you will be the creator. When you share the report with the colleagues, then they will be able to interact. They can interact with report in the view of the Reading. Then they are the consumers. This will be a great way to get familiar with the report editor.
Second Step is to start exploring with dataset:
Now you are connected to the data as well as start exploring. This is when you have found something more interesting. Then you can start creating the dashboard. This is to monitor as well as see how the changes will over time. Let us see how it will work.
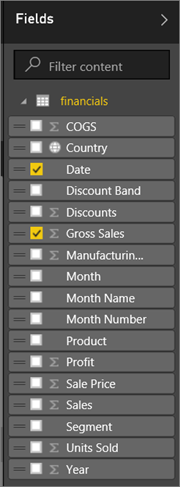
- In this report editor, we will use Fields pane. This will be on right hand side of the page which we want to build visualization. Select checkbox besides Gross Sales as well as Date.

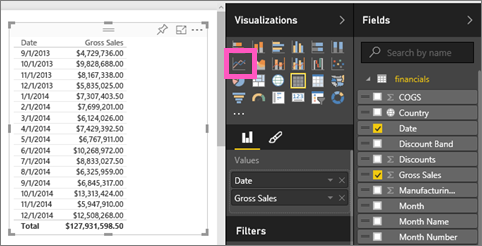
- Power BI will analyze these data as well as creates the visualization. Now let us consider that you select the Date first. Then you will see the table. In other case let us consider first you select the Gross Sales. Then you will see the chart. Let us switch with different way to display your data. Let us see these data as line chart. Select the icon of line chart. This is also known as a template. This is from the pane of Visualizations.
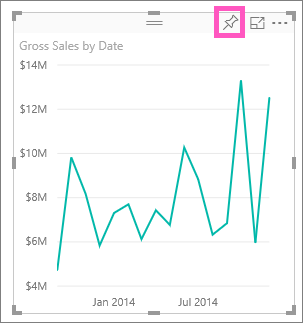
- This chart will look more interesting, so let us pin this to the dashboard. However, the visualization as well as select the icon of the Pin. When you will pin the visualization? Then it will store on the dashboard. Also, it will keep up to the date. So that, you can also track the value which are latest at the glance.
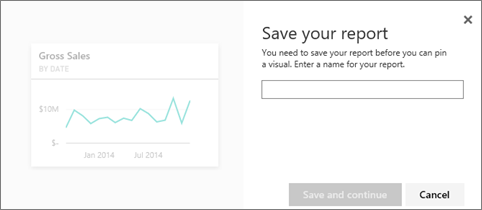
- Because of the newer report, it will prompt to save this. This is possible before you pin the visualization to dashboard. Give a name to your report. For example: Sales for over time. Then you can select Save as well as Continue.
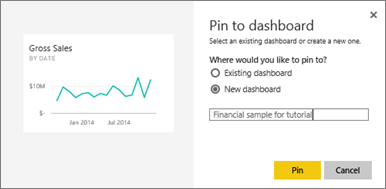
- Let us pin these lines chart to new dashboard. Then we name it as “Financial sample.”
- Select the Pin.
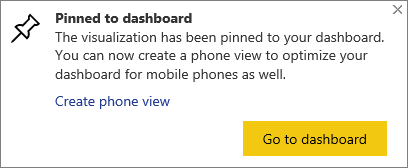
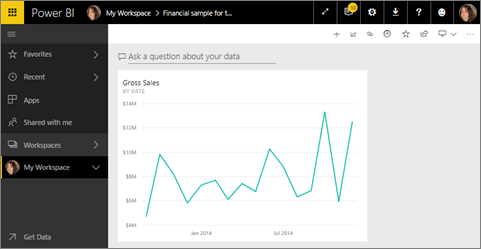
A Successful message will appear near top-right of the corner. Let you know these visualizations will add. This is as the tile. Especially, to the dashboard. - Select the Go to dashboard. This is to see a line chart pinned. This is as the tile, to the brand-new dashboard. This will make the dashboard even better. This is possible with the help of adding more tiles of visualization. Then we can rename, resizing, linking, as well as repositioning the tile.
Select a new tile. This will be on the dashboard. It will help to come back to report. Power BI will return you to report editor in the view of Reading. When we want to switch back to the Editing view, select the Edit report. This will be from top of the menu bar. Once in the Editing view, continue exploring as well as pinning tile.
Third Step is to continue with the Q&A exploration:
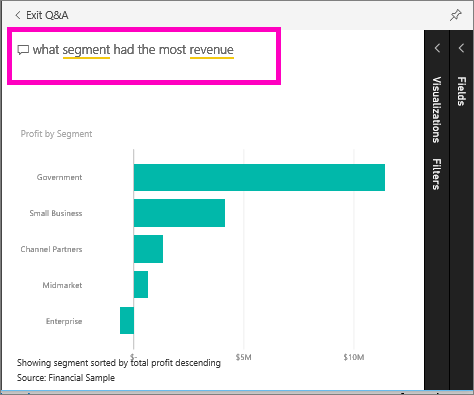
- For the quick check of data, try inserting a question in Q&A box. All the Q&A question box will locate at top of dashboard. Then ask the question about data. Also, it will be in top of the menu bar in the report. For example: type “what segment has most of revenue”.
- Q&A will search for the answer. This will present this in a form of visualization. Select the icon of pin. This is to show the visualization on dashboard as well.
- Point to the visualization. This is to “Financial Samples of the tutorial dashboard.”
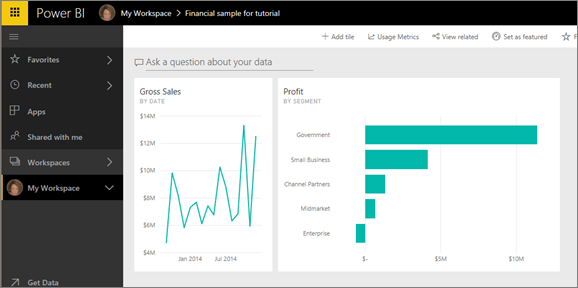
- Return to the dashboard. This is where you will see new tile.
 This is to show the visualization on dashboard as well.
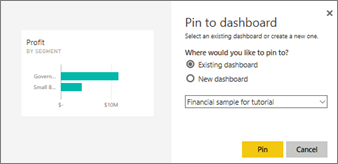
Clean up the resources:
Now you have finished the article. You can able to delete dataset, reports as well as dashboards.
- In left of the navigation bar, you can select the My Workspace.
- Select Datasets tab. Also, locate these datasets which you can import for this article.
- Select ellipses (…) > Delete.
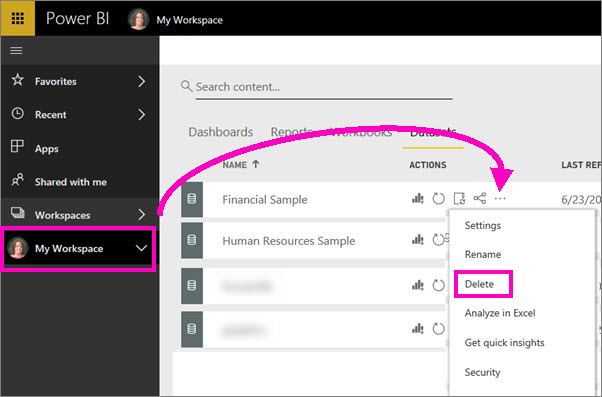
Delete the dataset. It will also complete deleting the report, dashboard.
Hope you understand about What is Power BI? Also, how to get Started with Microsoft Power BI.