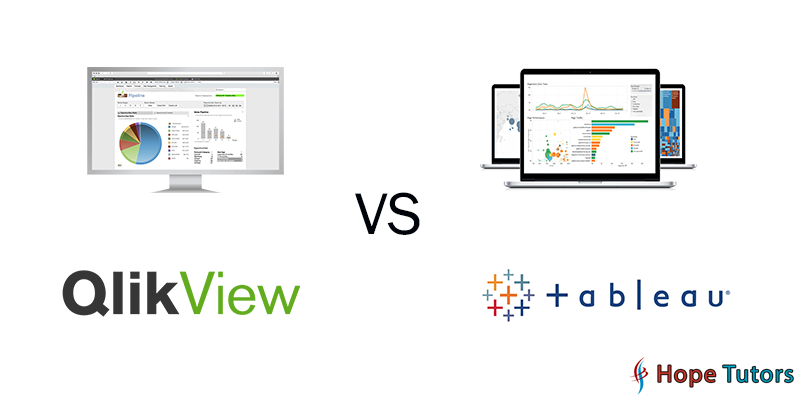
Here we describe differences between Qlikview and Tableau
Business Intelligence. That’s all the modern business sectors, large corporations, and enterprises depend upon. We are exposed to data more and more like never before. But too much of exposure to wide variety of data makes it very difficult to come to a decisive conclusion when decision-making is at play.
So analysing the large set of data to glean needful business intelligence is at the heart of both QlikView and Tableau – best and widely used data visualization tools. The best thing they both have achieved is to eliminating the necessity to have charts and one-dimensional static graphs to portray the statistics. We can visualize the data with these innovative tools. But they are fundamentally different in their inner workings and it is wise to know them.
The good news is our Hope Tutors, one of the best QlikView and Tableau training institutes in Chennai, provides both of these courses. Both the QlikView and Tableau course certification have proved to attract plenty of job opportunities recently.
QlikView
Why do we have to use archaic one-dimensional figures and charts to depict the statistical analysis while we can have visualized the same data? So with QlikView, we can create, exhibit, and share the statistical report of any subjects easily.
- The strength of QlikView is its quickness in analysing and comprehending the crucial relationships exists between various sets of data.
- And this data processing tool amasses data from a several and wide array of sources as far as connected databases and files. This accumulation of data, in turn, produce patterns of insights with QlikView’s distinctive analytical capabilities.
- QlikView is utterly user-friendly. Anyone with even a cursory understanding can design their own statistical representation and trace out needful organizational information.
- The optimization and scalability render the users to analyse the data to find insights.
- The strong visualization attributes of QlikView and business intelligence reporting tools are widely trusted by all the financial and insurance services.
- QlikView is notable for its ability to blend the visualization with in-memory business intelligence tools and ETL (Extract, Transform, and Load) engines.
- The technology partner network is very strongly connected together in QlikView and it has an active user community.
Tableau
The visualization competences of Tableau are uniquely varied and highly useful in data representation methods. To enrich the comprehension of the visual charts, Tableau provides influential properties such as bubble maps and word clouds. To add appropriate context for graphics, the treemaps provide multiple toolkits and additional handy materials.
The main goal of treemaps is to display relative proportions of numerous categories of information. We can also lay out a dashboard through a feature called overlaps, which is very useful to gather data in a neat format and to use screen space for greater purposes.
- Tableau contains far-reaching potentials like managing to combine various data sets, and because platform independence and other business intelligence techniques inherently imbued into its very design, we don’t need any add-ons.
- Multiple server systems administer Tableau’s server systems. Features like DataServer, Repository, Gateway / Load Balancer, and Application Server abounds in Tableau tool.
- QlikView is practically inefficient to create effective maps. But Tableau can create multi-dimensional maps, thanks to its geo-coding settings. This maps can be designed to indicate real-time updated salient features in a statistical data representations.
- The security features in Tableau is multi-faceted. It is so strong, that accessing the data without the knowledge of the user is completely disabled. Additional security measurements safeguard all the datasets with multiple safety tools.
Unlike any other tools in the market, sharing the visualization with other server systems is the major advantage of Tableau.